Customers
How customers measure results with Bhogar
Every Bhogar deployment starts from a baseline the customer already reports on and measures the result in the customer's own observability workspace. This page explains the method and the metrics we report.
Our reporting standard
- Customer names and logos are published only with written permission
- Quotes are attributed to a named person who approved them
- Every reported result is reproducible from the customer’s own data
- Anonymised stories omit details that could identify the customer
Method
How results are measured
- STEP 01
Baseline before anything is switched on
The metric, its formula, and the measurement window are agreed with the customer and captured from their own systems.
- STEP 02
Instrument the work, not the demo
Every run records inputs, sources, model, tools, edits, and approvals - with cost per run - on production traffic.
- STEP 03
Attribute conservatively
Only the platform’s actual contribution counts; other process or staffing changes are stated. Over-attribution loses the finance sponsor.
- STEP 04
Report where you can check it
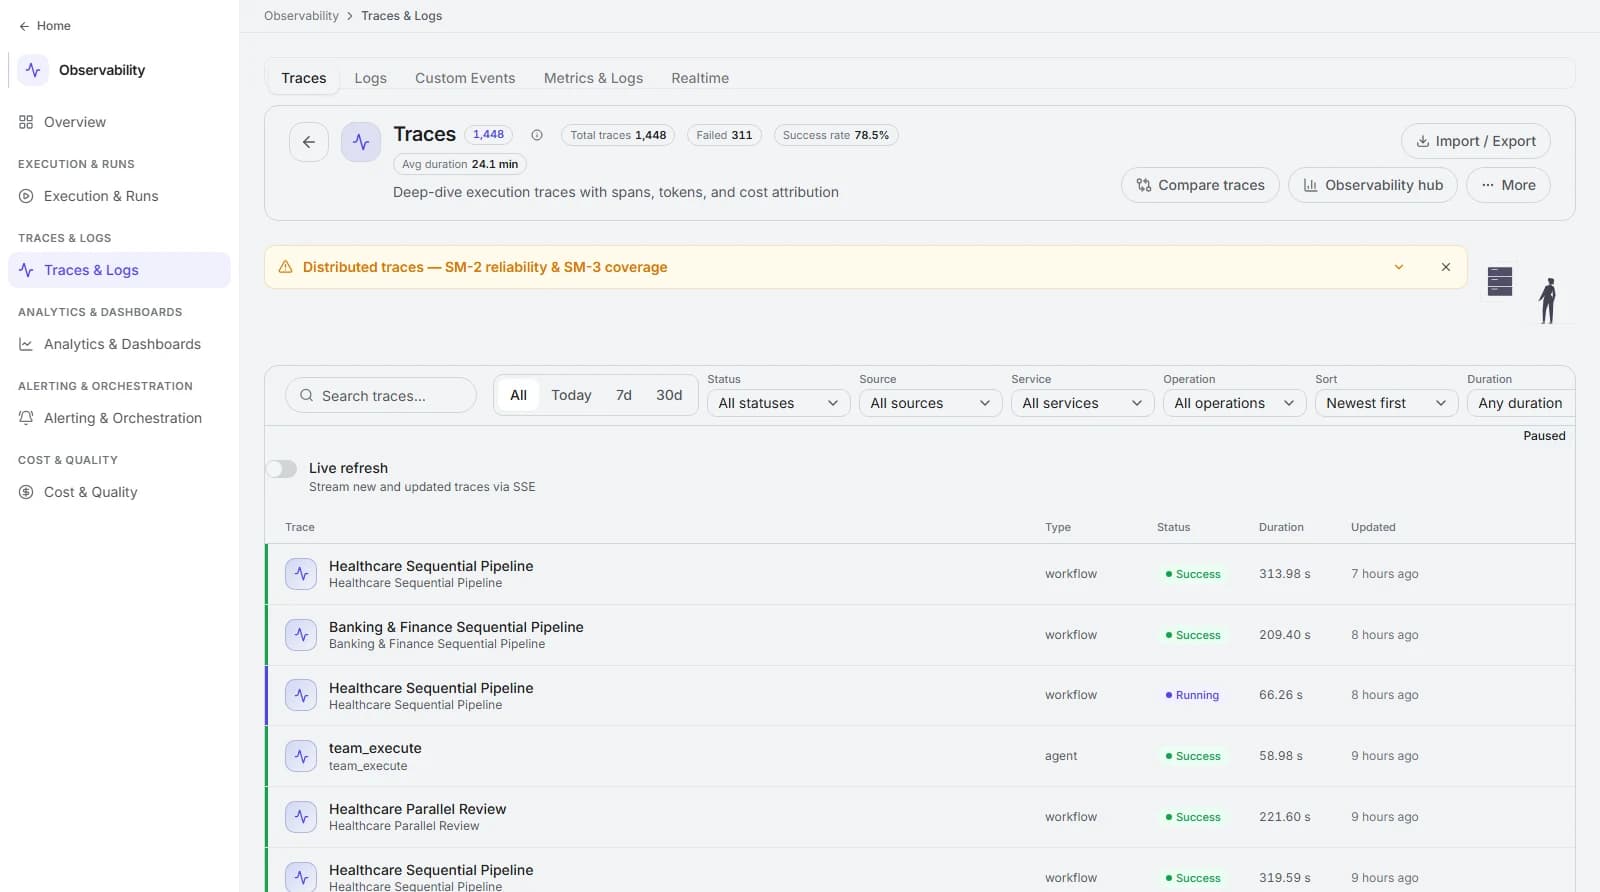
Results live in the customer’s Observe workspace, computed from their data and reproducible by their analysts.
Metrics
The metrics we report
Hours saved
(baseline min − post min) × volume ÷ 60
Segmented by role.
Cost per task
(human min × loaded rate + platform cost) ÷ resolutions
Fully loaded, including model spend.
Tasks deflected
resolved without a ticket ÷ total assisted
Abandoned sessions excluded.
Cycle time
median hours from trigger to approved outcome
Reported as median, never mean.
Cost to serve
total service cost ÷ units served
Before / after on identical definitions.
Payback period
(implementation + run cost) ÷ monthly value realised
Measured only, never projected.
Case studies
What a published case study includes
Each customer story follows the same structure so results can be compared and reproduced.
- Starting position
- Baseline volume and the measurement window.
- What was connected
- Named systems and explicit exclusions.
- What Bhogar does
- The specific end-to-end job and where humans review.
- Governance applied
- Entitlement, redaction, approval gates, evidence retention.
- Measured result
- The agreed metric, formula, comparison window, and a signed figure.
- Verification
- Who signed off and how it is reproduced from the customer’s Observe workspace.
Resources
Available today
Proof of value on your own data
Scoped, baseline agreed, result yours - whether or not you buy.
Architecture and security review
Workspace model, isolation, data flow, and residency - with your security team in the room.
The platform running
A walkthrough on your scenario, the governance surfaces, and the audit trail.
Reference conversations
When a customer agrees. No substitutions if none is available in your sector.
Run a proof of value on your data
A scoped proof of value with an agreed baseline, measured in your own workspace. You keep the results either way.