Platform
Observability & Tracing
Non-deterministic systems fail quietly. Observe records every run as a trace with cost, latency, and quality attached - so engineering can debug it, risk can audit it, and finance can price it. Same data, three answers.
How it works
From instrumentation to reporting
The loop is deliberately short: watch the aggregate, investigate the outlier, gate the fix, and let the same data feed the business case.
Instrument automatically
Runs are traced by the platform - there is no separate SDK to wire into every agent and workflow.
Capabilities
Observability capabilities
Traces, evaluation, quality, and cost live in one place because they answer one question together: is Bhogar working well enough to keep expanding it?
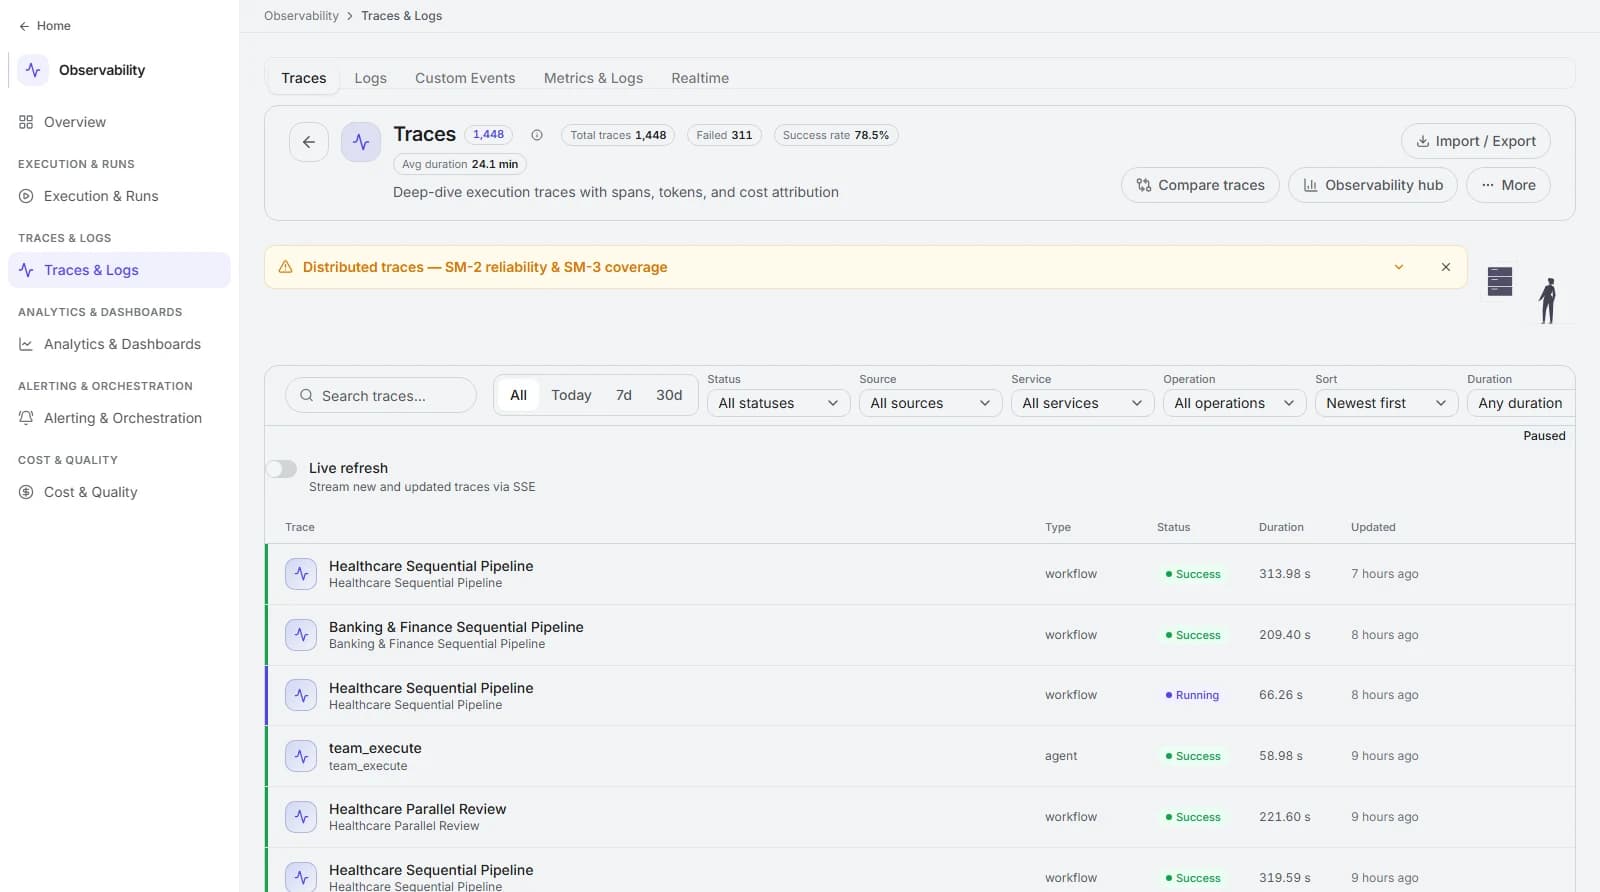
End-to-end tracing
Every run decomposes into spans - retrieval, model calls, tool calls, guardrail checks, workflow nodes - with inputs, outputs, and timings retained.
Portal - Observe → Tracing
Latency analysis
See where time goes inside a run and compare percentiles across versions, so tuning targets the slow span instead of the whole pipeline.
p50 / p95 per span and per route
Cost and token analytics
Token counts and provider cost are recorded per call, then rolled up by agent, workflow, team, and workspace.
cost per run - per team - per outcome
Evaluation suites
Score grounding, citation accuracy, policy compliance, task completion, and tone against datasets, with a gate per suite.
on-demand - scheduled - pre-promotion
Quality monitoring
Track scores and user feedback over time so a slow drift after a model or prompt change is visible before customers notice.
trend + regression detection
Alerts and budgets
Threshold alerts on cost, latency, error rate, and quality - with budget guards that act rather than only notify.
cost & budget alerts - alert routing
Trace comparison
Put two runs side by side to see exactly what a prompt, model, or retrieval change did to path, cost, and result.
A/B and before/after diffing
Audit-grade history
Guardrail verdicts, approvals, and policy versions live on the trace, so “what ran, under which policy” is answerable months later.
retained decisions + policy version
Value views on the same data
Because outcomes are recorded alongside cost, the same telemetry answers engineering and finance questions without a second pipeline.
shared telemetry → ROI reporting
Design decisions
Design decisions
These positions are why the same telemetry serves debugging, audit, and ROI instead of requiring three separate systems.
- Traces, not logs
- A log line tells you something happened. A span tree tells you what the agent retrieved, which model answered, what the tool returned, how long each part took, and what it cost - which is the only practical way to debug non-deterministic systems.
- Cost belongs on the trace
- Attributing spend after the fact from provider invoices cannot tell you which workflow or team caused it. Recording tokens and cost per span makes cost to serve computable per outcome.
- Evaluation is a gate, not a report
- Quality scores are only useful if something happens when they drop. Suites carry thresholds, and a failing suite blocks promotion of the agent, prompt, or workflow version that caused it.
- Quality regressions are usually silent
- Nothing errors when answers get subtly worse. Continuous scoring plus trend monitoring catches that class of failure, which is otherwise discovered by a customer complaint.
- One telemetry model for engineering and finance
- Engineering asks where the latency is; finance asks what a resolution costs. Both come from the same spans, so the two conversations stop using different numbers.
- Open standards, pluggable backends
- Telemetry follows OpenTelemetry conventions and can be exported to your existing observability stack - including Azure Application Insights and OTLP collectors - instead of trapping data in a silo.
Design decisions
Design decisions
These positions are why the same telemetry serves debugging, audit, and ROI instead of requiring three separate systems.
Visible spend per agent and workflow makes waste findable and cuttable.
Cost per run
token and provider cost aggregated per span
Predictable response time is a usability requirement, not a vanity metric.
Latency p95
span-level duration percentiles per route
Evidence that faster and cheaper did not quietly become worse.
Quality score trend
evaluation suite scores over time vs gates
Engineering time recovered when a bad run is explainable in minutes.
Mean time to diagnose
trace-to-root-cause investigations
Spend stays inside plan because guards act before the invoice.
Budget adherence
budget alerts and enforced ceilings per workspace
Regressions caught by a gate never reach the people you serve.
Incident avoidance
blocked promotions and pre-release failures
FAQ
Frequently asked questions
Do we have to instrument our agents and workflows ourselves?
Can traces be exported to the observability stack we already run?
How do evaluations differ from monitoring?
Are prompts and outputs retained in traces?
How does this connect to ROI reporting?
Related capabilities
Explore the rest of the platform
Outcomes
ROI & Value
Baseline, instrument, and report business value - hours saved, cost to serve, deflection, and payback.
Senses
Data & Integrations
Connect every source - documents, databases, SaaS, tickets, CRM, code, comms, and warehouses - into one safe layer.
Memory
Knowledge & RAG
Ingestion, chunking, embeddings, hybrid retrieval, freshness, and citations - Bhogar’s working memory.
See Bhogar on your own data
Book a 45-minute working session. We connect one of your sources, build one agent, run one governed workflow, and review the trace together.