Use case · Use case - Finance & operations
Reporting automation
Monthly packs, weekly service reviews, and quarterly business reviews consume analyst days in copying, formatting, and explaining. BhogarAI queries the source, drafts the commentary, flags the variances that matter, and routes it to the owner who signs it off.
ROI lever
Reporting hours and cycle time
Recurring reporting consumes senior analyst time on assembly rather than analysis, every single period. Because the work is predictable and repetitive, the baseline is easy to measure and the saving is easy to verify - which makes it one of the most defensible business cases available.
Reads from
- Warehouse and metric definitions
- Operational and finance systems
- Prior reports and commentary
- Plan, budget, and forecast
The problem
Reporting is assembly work performed by your most expensive analysts.
The report is late because gathering it is manual, and the commentary is thin because the person writing it ran out of time. Meanwhile the underlying data was ready days earlier.
Checked by hand today
- Data warehouse and marts
- Operational and finance systems
- Prior period reports
- Metric and KPI definitions
- Commentary and meeting notes
- Plan, budget, and forecast
““Why is this number different from last period, and is the explanation the same one we gave last time?””
Assembly crowds out analysis
Analysts spend the reporting cycle extracting, reconciling, and formatting. The insight that justifies the role gets whatever hours are left before the deadline.
Every report has its own definitions
The same metric is calculated slightly differently in three packs. Meetings are spent reconciling numbers rather than deciding what to do about them.
Commentary is written from memory
Variance explanations are recalled rather than traced, so the reasoning is unverifiable and the same question is asked again next period.
How Bhogar helps
How Bhogar handles reporting automation
Numbers come from safe queries against your warehouse using your own metric definitions - never from a model estimating a value. Bhogar writes the narrative around numbers it can reproduce.
Sources
- Warehouse and metric definitions
- Operational and finance systems
- Prior reports and commentary
- Plan, budget, and forecast
Outcomes
- Drafted report packs
- Ranked variance commentary
- Consistent metric definitions
- Approved, distributed reports
safe queries, not guessed numbers
Figures are produced by executing your defined metrics against the warehouse. The query and source table are shown with the report so any figure can be reproduced independently.
How it works →Variance detection with context
Movements against prior period, plan, and trend are identified and ranked by materiality, so commentary covers what changed rather than restating the table.
How it works →Explanations grounded in the record
Candidate explanations are drawn from operational systems, prior commentary, and known events - cited, so the owner is confirming evidence rather than recalling it.
How it works →Approval before distribution
Reports run on a schedule and stop at the named owner. Nothing reaches an executive audience without a human approving the numbers and the narrative.
How it works →
All your data
One definition per metric, queried at the source.
The hard part of reporting automation is not generation, it is agreeing the definitions. Once a metric is defined once and queried from the source, consistency stops being a review problem.
Data warehouse and marts
Curated tables and semantic models queried through approved tools, with the executed query recorded alongside every figure.
Metric definitions
The canonical calculation, grain, filters, and owner for each metric, so the same name always means the same thing.
Operational systems
Ticketing, CRM, billing, and delivery systems that hold the events behind a movement in the numbers.
Prior reports and commentary
Previous packs and the explanations given, so recurring causes are recognised and the narrative stays consistent.
Plan and forecast
Budget, forecast, and target data required to compute variance against plan rather than only against last period.
Event and change context
Releases, incidents, campaigns, pricing changes, and companyal events that explain why a number moved.
Governance built in
- Figures produced only by executing defined queries - the model writes narrative, it never estimates a value.
- The executed query and source shown with each figure so any number in the pack can be reproduced independently.
- Row-level warehouse permissions respected, so a regional report cannot expose data outside that region.
- Named-owner approval required before distribution; scheduled runs stop at review rather than sending.
- Version history of every report, its inputs, and its approver retained for audit and for period-on-period comparison.
The workflow
A monthly pack, from close to approved distribution.
The same workflow produces weekly service reviews, board packs, and regulatory returns - different definitions, same safe path.
The period closes
A schedule or an upstream data-readiness signal starts the run, so the report begins when the data is complete rather than when someone remembers.
In the portal
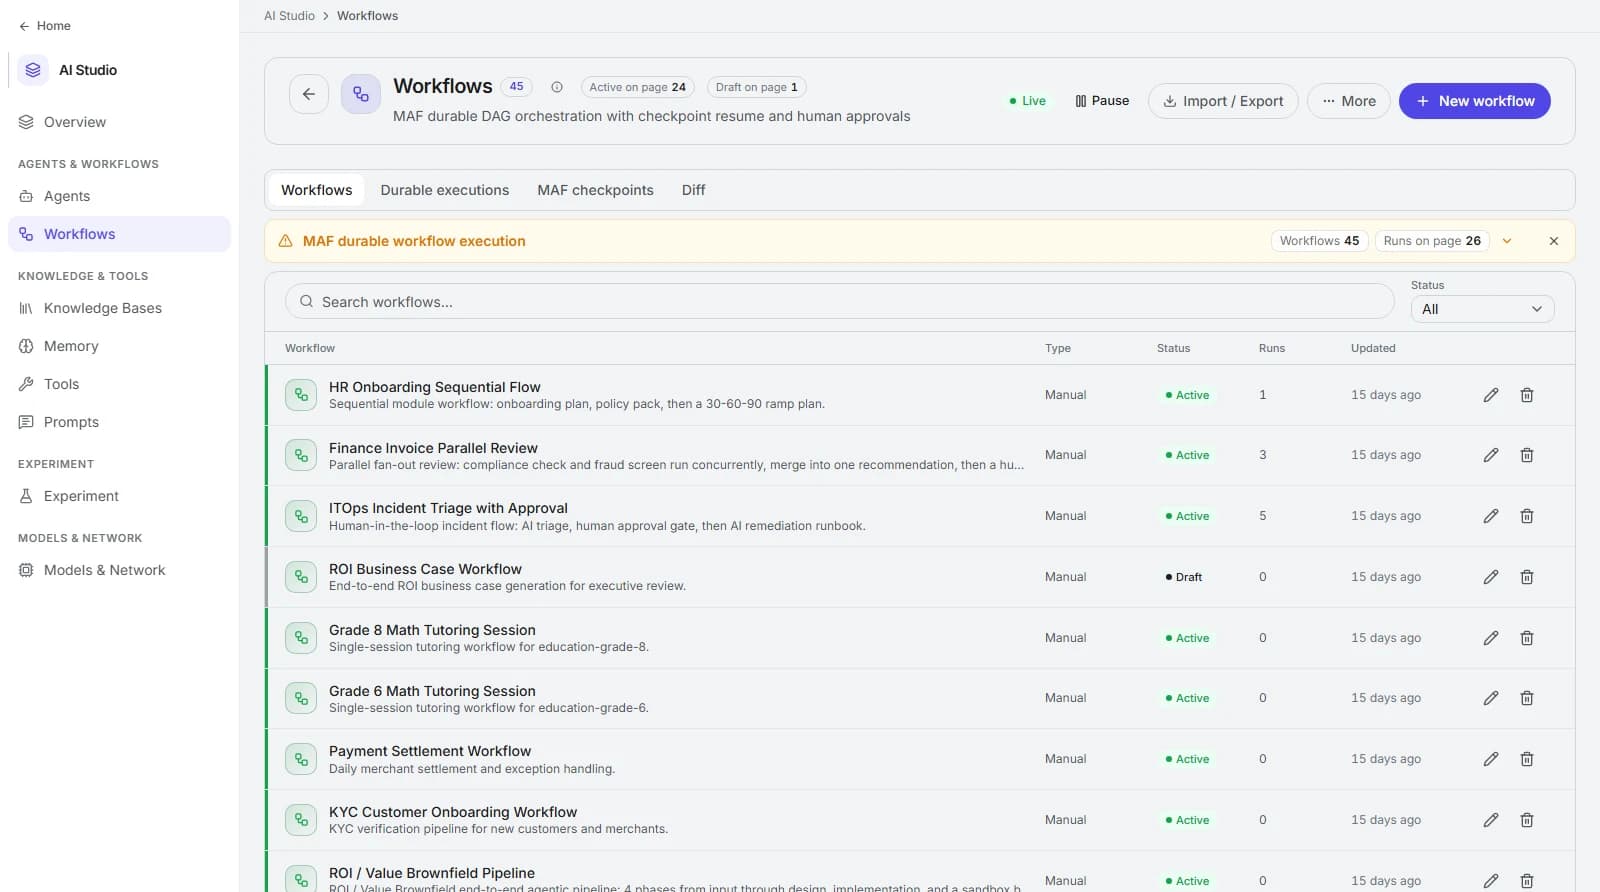
Durable workflows with approvals built in.
Multi-step processes - onboarding, invoice review, incident triage, KYC - run as checkpointed DAGs with human approval gates.
The return
The most measurable business case on this site.
You know how many reports you produce and roughly what each costs in analyst time. Baseline one cycle properly and the comparison is straightforward.
Reporting hours per cycle
Σ analyst hours across all recurring reports
Count assembly and formatting separately from analysis. Only the first should be attributed to automation.
Reporting cycle time
median hours from data ready to report approved
Shortening this is what turns a monthly pack into something people can still act on.
Commentary acceptance rate
draft commentary accepted without amendment ÷ total sections
The quality signal. A rate that is too high may mean owners have stopped reviewing properly, which is worth watching.
Definition consistency
metrics with a single canonical definition ÷ reported metrics
The structural fix. Every point of improvement here removes recurring reconciliation argument from meetings.
| Dimension | Before | With Bhogar |
|---|---|---|
| Producing the numbers | Extracts, spreadsheets, and manual reconciliation each period. | Defined queries executed at source, with the query shown. |
| Writing commentary | Written from memory in the hours before the deadline. | Drafted from ranked variances with cited explanations. |
| Metric definitions | Three packs, three slightly different calculations. | One canonical definition with an owner, used everywhere. |
| Distribution | Emailed by whoever finished last, with no approval record. | Approved by the named owner, with a version history. |
FAQ
Frequently asked questions
How do you stop the model inventing numbers?
We do not have consistent metric definitions. Is that a blocker?
Can it produce regulatory or statutory returns?
What happens when upstream data is late or wrong?
Keep exploring
Deflection
Resolve routine customer and employee contacts at the first touch, with account context and an honest escalation when the answer is not there.
Knowledge search
One question, every approved system - documents, tickets, code, wikis, and records - answered with citations and each person’s own permissions applied.
Incident response
Assemble the runbook, the recent changes, the comparable past incident, and the customer impact within seconds of a page - and draft the comms.
Automate one recurring pack.
Pick the report that costs the most analyst time, agree its definitions with us, and compare one automated cycle against your baseline.